.webp)

.svg)
Which metric to track at each stage of an Amazon DSP funnel
Which metric to track at each stage of an Amazon DSP funnel
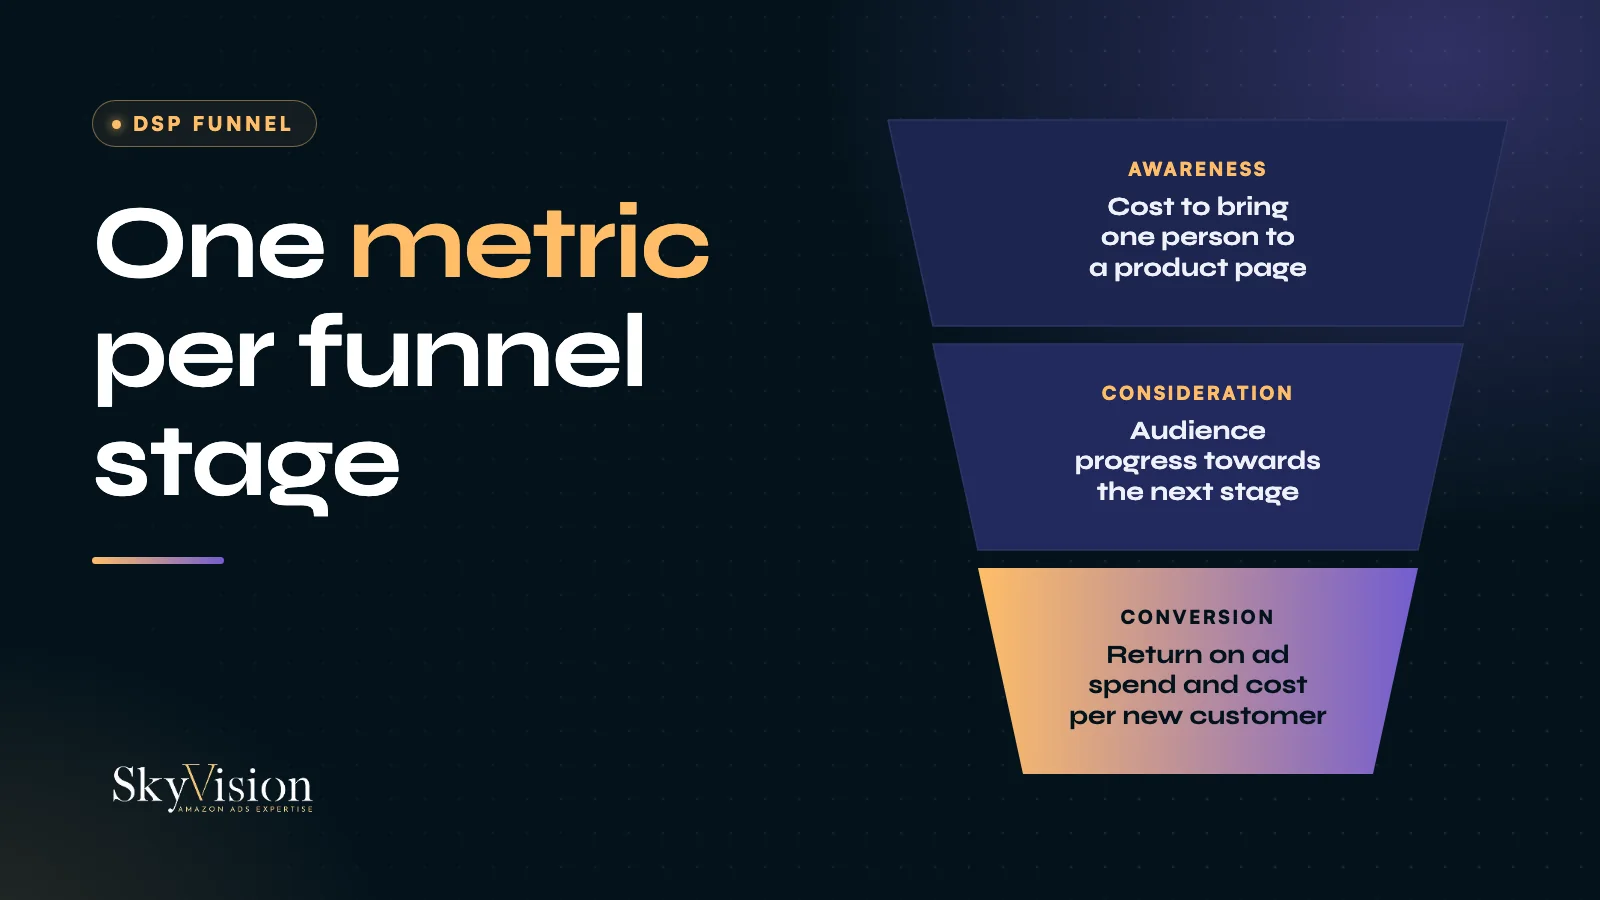
One metric per stage. Awareness is judged on the cost of the qualified traffic it sends, not on return on ad spend and not on new customers. Conversion is judged on return and on new customers. Apply the same metric everywhere and you will switch off the campaign that feeds the machine in order to keep the one that finishes other people's work.
The result that caught us out
One figure from this summer runs against almost everything written about upper funnel.
Of the purchases generated by our conversion campaigns, 58.3% came from new customers, at €15.80 per customer acquired.
Of those generated by our awareness campaigns, 41.6%, at €25.85.
Awareness is supposed to recruit. Conversion is supposed to finish the job. Here it was the other way round.
One clarification that avoids a common misreading: those percentages are the share of new customers within each stage's purchases. They are not the split of the 670 new customers recruited over the period, which was roughly 77% conversion and 23% awareness. Both readings are true and they do not say the same thing.
Why does conversion recruit more new customers than awareness?
Retargeting goes after people who viewed the product page and never bought. Technically, those are new customers. They were exposed, they did not convert, and the conversion campaign picks them up.
Broad awareness also brings back plenty of existing customers who recognise the brand. Its new-customer share is therefore diluted mechanically.
What matters here is that the conversion campaign consumes an audience pool it did not build.
So should you switch awareness off?
No. Because that is not the job it does.
Cost to bring one person to a product page, on the same account:
Awareness, 6.5 cents. Conversion, 37.5 cents.
Six times cheaper. In practice, 60,776 product page views for €3,955.
That is what awareness does. It fills the audience that retargeting will convert afterwards. It is judged on cost of qualified traffic, and on nothing else.
What happens if you switch awareness off?
This is the most dangerous part, and the hardest to see coming.
Retargeting consumes an audience pool it does not produce. Cut the source and your numbers do not move straight away. There is stock left, and for a few weeks everything looks fine.
The hole shows up later, when nobody can connect it to a decision any more. At that point people look for the cause inside the conversion campaigns, because that is where the number is falling. They do not find it, because it is somewhere else and it is two months old.
Which Amazon DSP KPIs should you track at each stage?
Awareness
Steering metric: cost to bring one person to a product page. Control metric: the volume of product page views generated, which tells you whether the pool is filling fast enough to feed the next stage.
What not to look at: the stage's return on ad spend, and its new-customer share. Both will make you switch off a campaign that is working.
Consideration
The hardest stage to judge and the one that demands the most patience. On our test it was 3% of budget and returned 0.38, which is two new customers for €401. The campaign had started delivering at the end of August, so we had no basis to conclude anything.
Steering metric: audience progression towards the next stage, not direct sales.
Conversion
Steering metric: return on ad spend and cost per new customer. It is the only stage where return can be read directly.
On the account cited, conversion was 65% of budget at a return of 3.40. Awareness was 32% of budget at 2.86. That second figure is already counterintuitive: a channel supposed to convert nothing sat close to the profitability of the search campaigns.
Returns do not add up
A reading trap, since we are on the subject of measurement by stage.
If you add up the sales attributed to each of your channels, you exceed reality. On this account, DSP plus Sponsored Ads comes to 65% of total revenue, which reflects double counting: the same person can see a banner and then click a Sponsored Product.
Which is why the final judgment is made on total revenue and total advertising cost of sales, never on the sum of the returns. On this account, TACoS was 22.5%, from €62,253 of ad spend against €276,221 of revenue.
What we would do differently
The split. 65% of budget on conversion, 32% on awareness. Given what awareness traffic costs, it should have had more.
That is the kind of decision you can only make after measuring each stage with its own metric. As long as everything is judged on return, awareness looks worse than conversion and gets less. Reading stage by stage reverses the conclusion.
How to set the split in practice
The stage metrics tell you how each campaign is doing. They do not directly tell you how to divide the money. One approach works reasonably well.
Start from the bottom. Fund conversion to the point where it stops finding audience to convert. That point is visible: frequency climbs, cost per new customer rises, and the pool of retargetable users stops growing. That is your conversion ceiling, and there is no reason to spend past it.
Then fund awareness to refill the pool at the rate conversion drains it. This is where cost per product page view earns its place: it tells you how much it costs to add one person to the pool, so you can size the upper funnel against consumption rather than against a percentage someone picked.
Consideration comes last, and only once the other two are stable. It is the hardest stage to read, and funding it before the others are settled means paying for a learning phase you will not be able to interpret.
Frequently asked questions
What return should you expect from an Amazon DSP awareness campaign?
The question is badly framed. Awareness is not judged on return. On our test it showed 2.86, which is high for that stage, but it is not the number the budget decision rests on.
How do you measure cost per product page view?
Divide campaign spend by the number of product page views it generated. Amazon reports that data on DSP, alongside the other metrics listed in its DSP glossary. It is the most direct way to judge an upper funnel stage.
Do you need DSP to run a funnel by stage?
No, but it is the only Amazon channel giving access to all three stages with distinct metrics. Sponsored formats mostly cover the bottom and part of the middle of the journey.
How long before these metrics are reliable?
30 to 45 days of learning on DSP. No automation has shortened it. Judging at two weeks leads to cutting at the worst possible moment, right before campaigns start working.
We will look at how you judge each stage
If you judge upper funnel campaigns on return on ad spend, we will show you what that actually costs and what you may be about to switch off. The range effect is covered in our article on measuring brand halo, and the entry conditions in our article on Amazon DSP minimum budget. This is the core of what an Amazon Ads agency running DSP actually does. Request an audit of your account. Free, no commitment.
The budget splits and cost per product page view quoted here come from a single account, beauty and fragrance, July to August 2026, anonymised and published with the client's consent. Two months, including a 30 to 45 day learning phase. We are describing a way of reading a funnel, not thresholds to copy. Past performance does not guarantee future performance, and results vary by catalogue, budget, category and competition.


