.webp)

.svg)
Four signals that your Amazon account has hit its advertising ceiling
Four signals that your Amazon account has hit its advertising ceiling
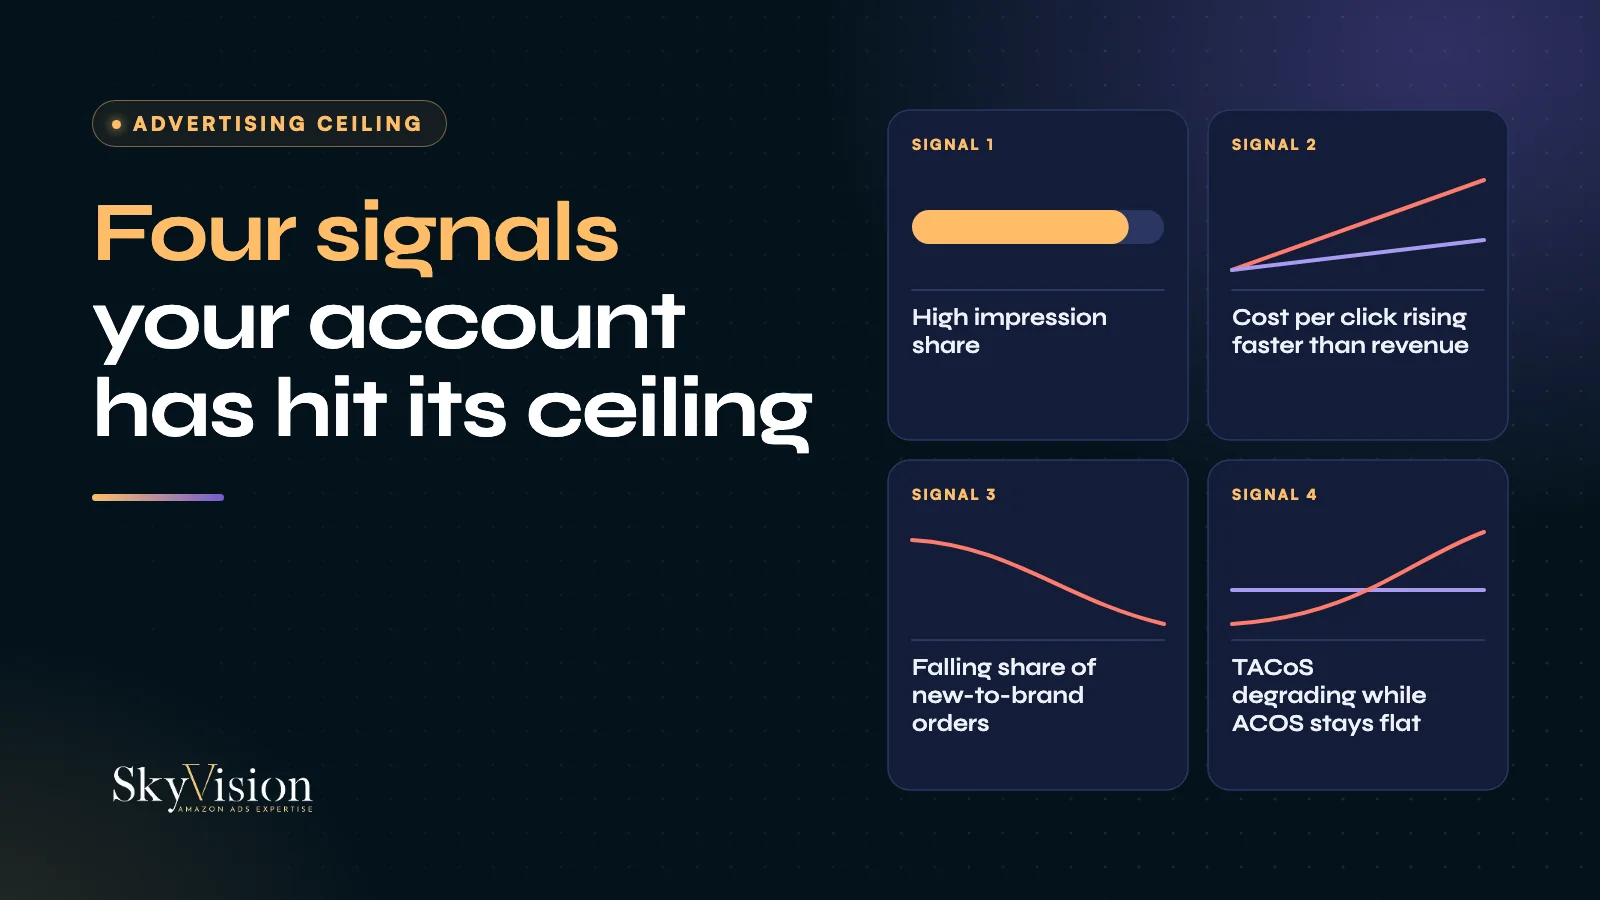
Four signals tell you whether your Amazon advertising has reached its structural limit. High impression share on your main search terms, cost per click rising faster than revenue, a falling share of new-to-brand orders, and total advertising cost of sales degrading while ACOS stays flat. Open your console and you can check all four in twenty minutes. Two in the red and the problem is no longer account management.
Quentin, co-founder of SKYVISION, walks through these four signals on a real account in this video (9 minutes, in French, English subtitles available):
First, what these signals do not measure
They do not measure how well your account is being run. An account can be managed extremely well and still hit the ceiling, because the ceiling is not an optimisation problem.
What follows answers a different question: is the market you are buying still expandable?
Signal 1. Is your impression share high on your main search terms?
Pull your top-of-search impression share on your ten most important search terms. Not account-wide. The ten that make your revenue.
Above 60 to 70% on those terms, the question changes shape. It stops being how do I take more, and becomes is what remains worth what I will have to pay for it.
Because what remains is the most contested inventory in the category. The impressions that the bidders with the best margin, the best conversion rate or the deepest pockets also want. To take one from them, you have to outbid them.
One useful nuance: impression price also varies by hour of day. You are not fighting the same battle at 9am and at 10pm. It is one of the few places where affordable volume remains once the rest of the term is saturated.
Signal 2. Is your cost per click rising faster than revenue?
Pull your average CPC and your advertising revenue over the last six months and put the two curves side by side.
If CPC is up 30% while revenue is up 5%, the reading is simple. You are paying more for exactly the same traffic. That is not growth, it is inflation you are absorbing.
This signal is the easiest to pull from standard reports and it is often the one that triggers the realisation. It has one flaw: it arrives late. By the time the gap is visible over six months, marginal cost tipped over several months ago.
Signal 3. Is your share of new-to-brand orders falling?
The most revealing of the four, and the one almost nobody looks at.
Look at the percentage of new-to-brand orders, not the volume. Volume can rise simply because you are spending more, while the share quietly erodes.
If that percentage falls while your budget increases, it means one thing. You are rebuying your own customers. You are paying for sales you would have made anyway, to people who already knew you and were coming back on their own.
A methodological caveat matters here. Amazon does not report new-to-brand on Sponsored Products. The metric exists on Sponsored Brands, Sponsored Display (which Amazon now calls display ads) and DSP only. Your reading is therefore partial by design, and you should know that before drawing conclusions. The full consequence is covered in our comparison of cost per new customer by channel.
Signal 4. Is your TACoS degrading while ACOS stays flat?
The sneakiest of the four, because it hides behind good news.
Your ACOS is stable. You are shown that every month, everything looks fine. But your total advertising cost of sales is climbing.
TACoS divides total ad spend by total account revenue. Amazon publishes the definitions of return on ad spend and related metrics. Not by advertising revenue. A lot of reporting stops just short of that calculation, which is why this signal stays under the radar longer than the others. It appears on no campaign report.
What it tells you: the share of your revenue that depends on advertising is growing. Your paid activity is no longer adding to your organic sales, it is replacing them.
A flat ACOS is reassuring. A rising TACoS at flat ACOS means you are no longer buying growth. You are buying dependency.
Three things to rule out before you conclude
The four signals describe a market limit. Three ordinary problems produce the same readings and are much cheaper to fix, so check them first.
Stock availability. A product that goes out of stock loses ranking and impression eligibility, then recovers slowly. Six weeks of intermittent stock will distort CPC and impression share badly enough to look like a ceiling.
Listing conversion rate. If conversion has dropped on your main ASINs, your bids buy the same clicks for fewer orders. That reads as rising cost per acquisition without any change in the auction.
Category events. An Amazon event inside your comparison window, or a competitor running a heavy promotion, will move impression price for a few weeks and then stop. Compare like windows before treating the change as structural.
If all three are clean and the signals still hold across two or three months, then the reading is a genuine ceiling.
How do you read the result of these four signals?
A single signal can have a one-off explanation. Seasonality, a product launch, a competitor who opened the taps on one term for six weeks.
Two signals in the red at the same time is something else. You no longer have an account management problem, you have a channel structure problem. And it does not get solved by raising bids, because raising bids means paying even more for the part of the market that is already the most expensive. The mechanism is explained in our article on why increasing your Amazon Ads budget stops moving revenue.
If no signal is in the red, that conclusion is worth having too: there is still affordable volume where you already are. This is not the moment to open another channel.
Frequently asked questions
What is the difference between ACOS and TACoS?
ACOS compares ad spend to the revenue generated by advertising. TACoS compares it to total account revenue, paid and organic combined. The first measures campaign efficiency, the second measures how dependent you are on advertising.
Is a 22% TACoS high?
It depends entirely on your margin and your objective. On a beauty and fragrance account we manage, 22.5% is sustainable. On a 20% margin it would not be. There is no good TACoS in the abstract, only one your P&L can carry or cannot.
What do you do when two signals are red?
Stop adding budget to the same search terms. Search volume on a given term is finite and you already own most of it. The way out runs through a lever that acts before the search, reaching people who are not looking for you yet. That is what Amazon DSP does, provided your account is ready for it.
How long does this check take?
About twenty minutes if your reports are accessible. The first three signals come from the advertising console. The fourth needs total account revenue, which comes from Seller Central or Vendor Central, not from the console.
Run the check, then tell us what you found
We look at your numbers and tell you honestly whether you are at the ceiling. If you are not, we say so too, and in that case opening another channel is not the priority. We run this diagnosis every month as an Amazon Ads agency and verified partner. Send us your numbers and we will audit them, free, no commitment.
The 22.5% total advertising cost of sales quoted above comes from one client account, beauty and fragrance, July to August 2026, anonymised and published with consent. Two months of observation with a 30 to 45 day learning phase inside it: this is an example of how to read the number, not a category benchmark. What is sustainable there may not be sustainable for you, and past performance guarantees nothing.


